Graph paper, characterized by its grid of horizontal and vertical lines intersecting at regular intervals, serves a variety of purposes across multiple disciplines. Its uniform grid structure provides a precise framework for graphing mathematical functions, plotting data points, and creating accurate diagrams. In mathematics and engineering, it facilitates the visualization of mathematical concepts such as functions, equations, and geometric shapes, aiding students and professionals alike in understanding complex relationships.
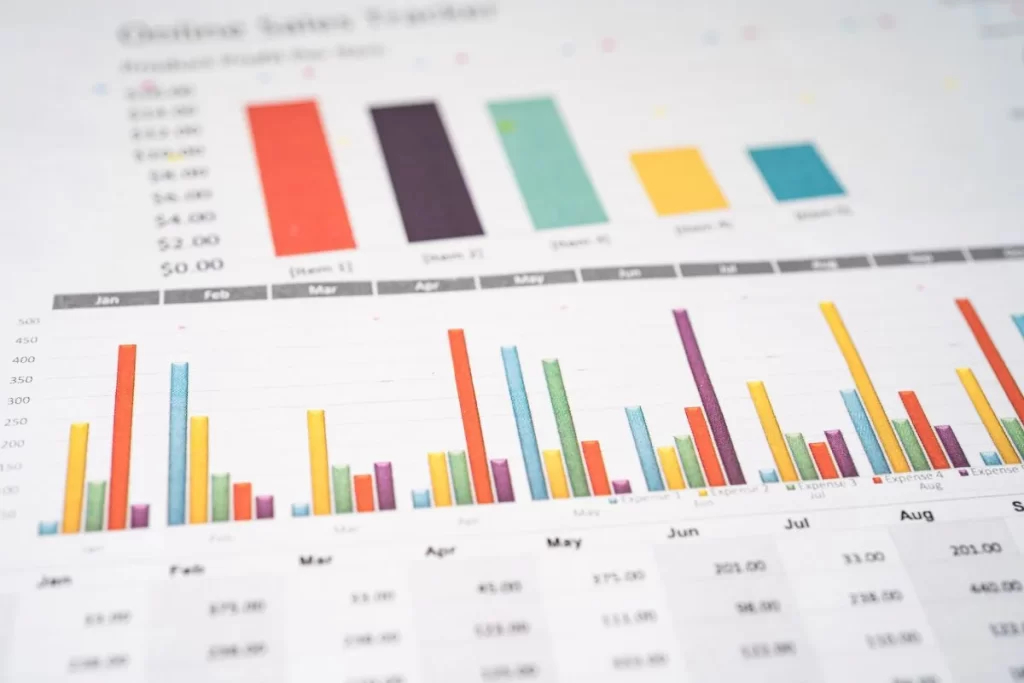
Additionally, in scientific research, graph paper is frequently employed for plotting experimental data, constructing charts, and analyzing trends. Enabling researchers to visually represent and interpret their findings effectively. Furthermore, in architectural and design fields, serves as a fundamental tool for sketching and illustrating spatial relationships. Offering a convenient way to translate ideas into tangible representations. Overall, the versatility and practicality of graph paper make it an indispensable resource across various educational and professional in visual communication and problem-solving.
Types
Here are some types of graph paper presented:
Standard: Features a grid of evenly spaced horizontal and vertical lines, typically used for plotting coordinates, graphing functions, and drawing diagrams.
Engineering: Similar to standard graph paper but with thicker lines at specific intervals, often used in engineering and technical applications for precision drawings and diagrams.
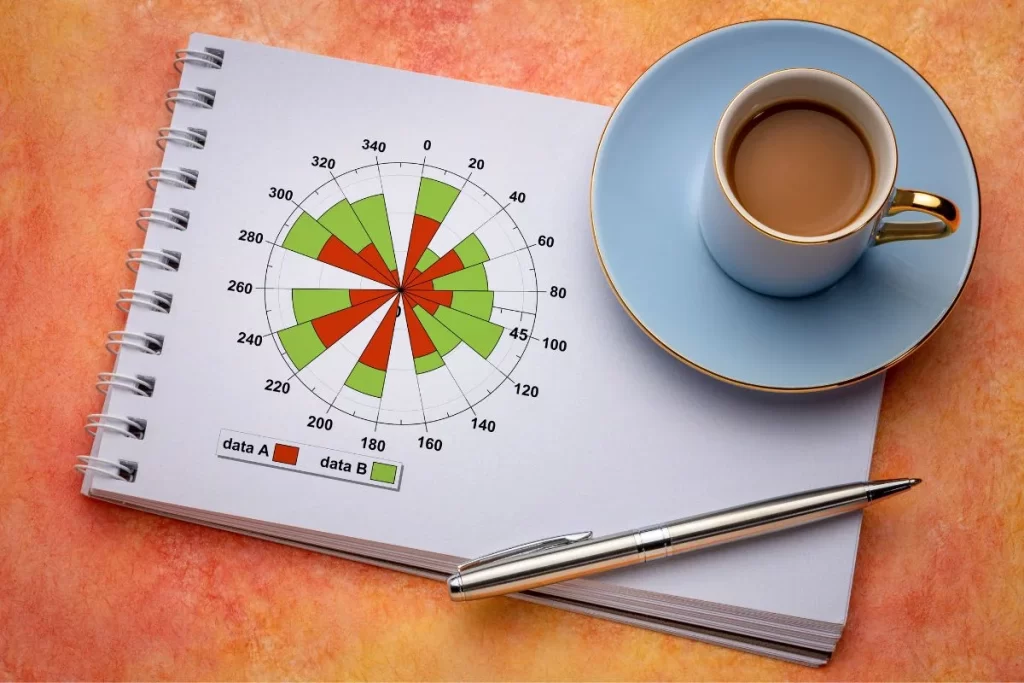
Polar: Utilizes concentric circles and radial lines instead of traditional Cartesian coordinates, commonly employed in mathematics for graphing polar functions and visualizing trigonometric relationships.
Isometric: Features a grid of equilateral triangles instead of squares, facilitating the drawing of three-dimensional objects and designs with depth and perspective.
Logarithmic: Scales logarithmically along one or both axes, frequently used in scientific and engineering contexts for plotting data that spans a wide range of values, such as exponential growth or decay.
Semi-log: Combines logarithmic and linear scales on its axes, suitable for representing data that exhibits exponential behavior along one axis while maintaining a linear scale along the other.
Hexagonal: Consists of a grid of hexagons rather than squares, useful for certain types of geometric and spatial analysis, as well as for designing tessellations and patterns.
Coordinate graph paper is an essential tool used in various fields such as mathematics, engineering, architecture, and data analysis. Its grid structure helps in plotting points, creating graphs, and visualizing mathematical functions….