Coordinate graph paper is an essential tool used in various fields such as mathematics, engineering, architecture, and data analysis. Its grid structure helps in plotting points, creating graphs, and visualizing mathematical functions. In this guide, we’ll explore everything you need to know about coordinate graph paper, its types, uses, and tips for effective utilization.
Coordinate Graph Paper Templates:
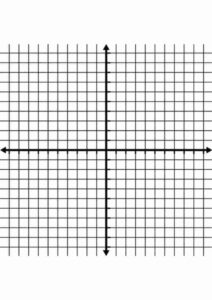
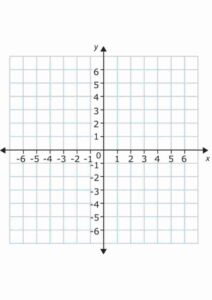
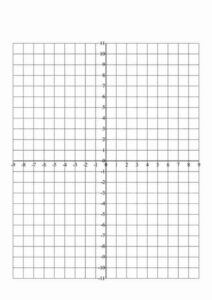
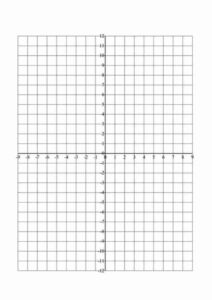
Coordinate graph paper consists of horizontal and vertical lines that intersect at regular intervals, forming a grid of squares. Each square represents a unit of measurement, making it easy to plot precise points and draw accurate graphs.
Types of Printable Coordinate Graph Paper:
- Cartesian Coordinate Paper:
- Features perpendicular axes (x-axis and y-axis) used for plotting points in two dimensions.
- Ideal for graphing linear equations, functions, and geometric shapes.
- Polar Coordinate Paper:
- Uses radial lines and concentric circles to represent coordinates in polar coordinates.
- Suitable for graphing polar equations and visualizing circular patterns.
- Logarithmic Coordinate Paper:
- Scales logarithmically, making it useful for plotting exponential functions and data sets that grow exponentially.
Uses of Plane Coordinate Graph Paper:
- Mathematics Education:
- Helps students learn graphing concepts, understand functions, and visualize mathematical relationships.
- Enables teachers to demonstrate graphing techniques and analyze student progress.
- Engineering and Architecture:
- Used for designing blueprints, plotting coordinates for construction projects, and visualizing spatial relationships.
- Essential for creating scale drawings, floor plans, and technical diagrams.
- Data Analysis and Science:
- Facilitates data visualization by plotting data points on graphs for trend analysis, pattern recognition, and forecasting.
- Supports statistical analysis, regression modeling, and hypothesis testing.
Tips for Effective Use of the Coordinate Graph Paper Template:
- Use a Sharp Pencil or Fine-tip Pen:
- Ensure accuracy by using a sharp pencil or fine-tip pen for plotting points and drawing lines.
- Avoid using thick markers or pens that may obscure grid lines and lead to imprecise graphs.
- Label Axes and Units:
- Clearly label the x-axis, y-axis, and units of measurement (e.g., inches, centimeters) to provide context and clarity to your graphs.
- Include axis titles and units on the graph to enhance readability and understanding.
- Use different colors or line styles:
- Differentiate between multiple data sets or functions by using different colors or line styles (e.g., solid, dashed, or dotted).
- Color-coded graphs improve visual interpretation and make it easier to identify trends or compare data points.
- Practice Consistency Scale:
- Maintain a consistent scale throughout your graph to ensure a proportional representation of data points.
- Adjust the scale based on the range of values to prevent overcrowding or sparse plotting.
Conclusion:
Coordinate graph paper is a versatile tool that enhances visualization, analysis, and communication of data in various fields. Whether you’re a student learning graphing techniques or a professional creating complex diagrams, mastering coordinate graph paper is essential for accurate representation and effective communication of mathematical concepts and data. Incorporate the tips mentioned in this guide to elevate your graphing skills and achieve precise results in your endeavors.