Graph paper with X Axis and Y Axis, a simple yet powerful tool, serves as a fundamental aid in visualizing data, making calculations, and analyzing trends across various disciplines. Its structured layout, with intersecting horizontal and vertical lines forming a grid, provides a canvas for plotting points, drawing curves, and creating diagrams. In this article, we delve into the intricacies of graph paper, examining its historical significance, types, applications, and the underlying mathematics of its Cartesian coordinate system.
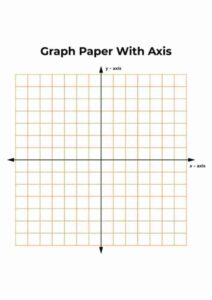
Graph Paper with X-Axis and Y-Axis Template PDF:


The concept of graphing coordinates dates back to ancient Greece, where mathematicians like Euclid explored geometric concepts using a coordinate-like system. However, the modern graph paper we use today emerged during the 18th century with the development of Cartesian coordinates by René Descartes. Descartes introduced the idea of plotting points on intersecting axes, laying the foundation for analytical geometry.
Initially, graphing was done on plain paper with hand-drawn grids. It wasn’t until the 19th century that printed graph paper became widely available, facilitating accurate graphical representations in mathematics, engineering, and the sciences. Over time, advancements in printing technology led to the production of specialized graph paper for specific purposes, such as logarithmic, polar, and isometric graphing.
Cartesian Coordinate System Of Graph Paper:
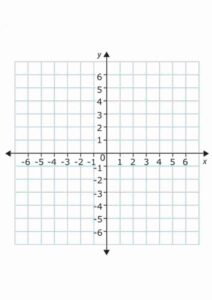
The Cartesian coordinate system, named after Descartes, is the basis for graphing on paper. It consists of two perpendicular lines known as the x-axis and y-axis. The point where these axes intersect is called the origin, typically denoted as (0,0). Each axis extends infinitely in both positive and negative directions, allowing for the representation of real numbers.
The x-axis represents horizontal values, while the y-axis represents vertical values. Points on the graph are expressed as ordered pairs (x, y), where x denotes the distance from the y-axis (positive to the right, negative to the left), and y denotes the distance from the x-axis (positive upwards, negative downwards). This system enables precise plotting of data points and the creation of graphs that visualize mathematical functions and relationships.
Types of X Axis and Axis Graph Paper Template word:
Graph paper comes in various types, each tailored to specific needs:
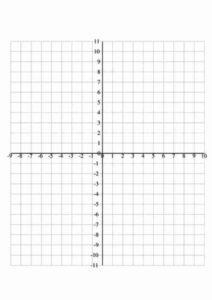
- Standard Graph Paper: This type features evenly spaced horizontal and vertical lines, typically with squares of equal size, making it suitable for general graphing and mathematical calculations.
- Logarithmic Graph Paper: Used for plotting data that follows logarithmic scales, this paper has logarithmic divisions along one or both axes, allowing for accurate representation of exponential growth or decay.
- Polar Graph Paper: Designed for graphing polar coordinates, this paper uses concentric circles and radial lines, with angles marked around the origin, facilitating the depiction of polar functions and curves.
- Isometric Graph Paper: With equilateral triangles instead of squares, this paper is used for isometric drawings, architectural designs, and three-dimensional representations, maintaining equal distances between axes.
- Semi-Log Graph Paper: Combining linear and logarithmic scales, semi-log paper is used in scientific and engineering applications to plot data with one logarithmic axis and one linear axis.
- Hexagonal Graph Paper: Featuring hexagonal grids, this paper is used in specialized fields such as crystallography, gaming design, and organic chemistry, offering a unique perspective for spatial arrangements.
Applications of Graph Paper With X axis and Y Axis:
Graph paper finds extensive use across diverse domains:
- Mathematics: Students and professionals use graph paper to plot functions, solve equations, graph inequalities, and visualize geometric shapes like triangles, circles, and parabolas.
- Engineering: Engineers utilize graph paper for technical drawings, schematics, architectural layouts, and structural designs, ensuring accuracy and scale representation.
- Sciences: Researchers in physics, chemistry, biology, and environmental sciences use graph paper for data analysis, plotting experimental results, and creating scientific diagrams and charts.
- Statistics: Statisticians employ graph paper to construct histograms, scatter plots, box plots, and other statistical graphs, aiding in data interpretation and trend analysis.
- Art and Design: Artists, architects, and designers use graph paper for sketching, perspective drawings, pixel art, and creating intricate patterns, leveraging its grid structure for precision and proportion.
The Mathematics Behind X Y Axis Graph Paper:
Graph paper reflects fundamental mathematical principles, including:
- Coordinates and Distance: The distance between two points on graph paper can be calculated using the distance formula √((x2 – x1)^2 + (y2 – y1)^2), where (x1, y1) and (x2, y2) are the coordinates of the points.
- Linear Equations: Straight lines on graph paper represent linear equations of the form y = mx + b, where m is the slope and b is the y-intercept.
- Quadratic Equations: Parabolic curves on graph paper correspond to quadratic equations of the form y = ax^2 + bx + c, where a determines the shape of the parabola.
- Trigonometric Functions: Sinusoidal waves, such as sine and cosine functions, can be graphed on paper using the unit circle or polar coordinates.
Conclusion
Graph paper serves as a timeless tool that bridges mathematical concepts with practical applications across disciplines. Its structured grid fosters precision, clarity, and creativity in graphing, making it indispensable in education, research, design, and problem-solving. Understanding the dynamics of graph paper not only enhances graphical proficiency but also deepens appreciation for the mathematical foundations that underpin its utility in diverse fields.