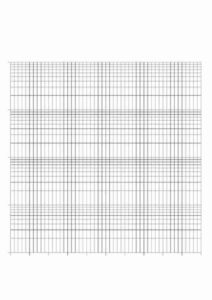
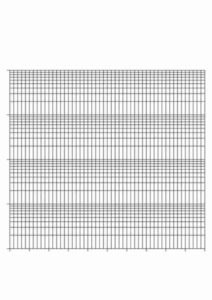
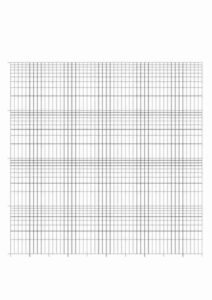
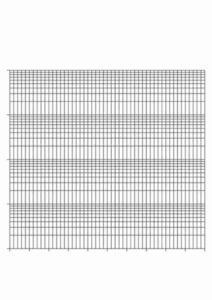
Semi log Graph Paper Plays very important role in the mathematics world. In the realm of mathematics, science, engineering, and data analysis, graphical representations play a crucial role in visualizing complex relationships and patterns. One such graphical tool that holds significant importance is semi-log graph paper. This article aims to delve deep into the intricacies of semi-log graph paper, its structure, applications, and how it contributes to effective data analysis.
Table of Contents
ToggleSemi-Log Graph Paper Template PDF:
Semi-log graph paper is a specialized type of graph paper that combines linear and logarithmic scales on its axes. Unlike regular graph paper where both axes typically use linear scales, semi-log paper features one linear scale axis (usually the horizontal axis or x-axis) and one logarithmic scale axis (usually the vertical axis or y-axis). This unique combination makes it particularly useful for plotting data that covers a wide range of values, especially when one variable varies exponentially.
Structure of Semi-Log Graph Paper Word:
The structure of semi-log graph paper is designed to accommodate both linear and logarithmic scales seamlessly. Let’s break down its components:
- Horizontal Axis (X-axis): This axis represents the independent variable and is typically marked with equally spaced linear divisions. The scale can vary depending on the specific data range being plotted.
- Vertical Axis (Y-axis): Unlike the linear scale on the x-axis, the y-axis on semi-log graph paper features a logarithmic scale. This means that equal distances along the y-axis represent equal ratios of the plotted variable rather than equal differences.
- Grid Lines: The grid lines on semi-log graph paper are designed to assist in accurate plotting of data points. The horizontal grid lines are evenly spaced, reflecting the linear scale, while the vertical grid lines are spaced according to the logarithmic scale.
- Labels and Units: Proper labeling of axes and units is essential for clarity and interpretation of the graph. The x-axis is labeled with the independent variable and its units, while the y-axis is labeled with the dependent variable and its appropriate logarithmic units (e.g., logarithmic scale factors such as powers of 10).
- Title and Legends: A descriptive title for the graph and legends (if multiple datasets are plotted) provide context and aid in understanding the information presented.
Applications of Semi-Log Graph Paper Templates:
Now that we understand the structure of semi-log graph paper, let’s explore its diverse applications across various disciplines:
- Exponential Growth and Decay: this type of graph paper are commonly used to depict phenomena involving exponential growth or decay. Examples include population growth, radioactive decay, bacterial growth, and economic trends.
- Scientific Data Analysis: In scientific research, semi-log graphs are instrumental in analyzing data that spans several orders of magnitude. This is particularly useful in fields such as biology, chemistry, physics, and environmental science.
- Engineering and Technology: Engineers often utilize semi-log graph paper for analyzing data related to signal processing, electrical circuits, mechanical vibrations, and other engineering applications where logarithmic scales are relevant.
- Financial and Business Analysis: In finance and business, semi-log graphs can represent exponential trends in stock prices, market shares, revenue growth, and other key performance indicators.
- Educational Purposes: Semi-log grid paper is extensively used in educational settings to teach students about logarithmic scales, exponential functions, and how to interpret graphical data.
Tips for Using Graph Paper Semi-Log Effectively:
To make the most of semi-log graph paper, consider the following tips:
- Choose the Right Scale: Determine whether a semi-log scale is suitable for your data. If your data exhibits exponential behavior or spans a wide range of values, semi-log paper is likely appropriate.
- Label Axes Clearly: Ensure that both axes are clearly labeled with appropriate units. Include logarithmic scale factors if necessary to avoid misinterpretation.
- Use Logarithmic Transformation: If your data doesn’t naturally follow a logarithmic pattern but you still want to use semi-log paper, consider applying a logarithmic transformation to your data before plotting.
- Plot Data Accurately: Take care to plot data accurately on the graph paper, paying attention to both the linear and logarithmic scales. Use a ruler or graphing software for precision.
- Interpretation: When interpreting the graph, keep in mind that equal distances along the logarithmic scale represent proportional changes rather than absolute differences.
Conclusion:
Semi-log graph paper is a valuable tool for visualizing and analyzing data that exhibit exponential behavior or span a wide range of values. Its unique combination of linear and logarithmic scales makes it versatile across various disciplines including science, engineering, finance, and education. By understanding its structure, applications, and best practices for usage, individuals can leverage semi-log graph paper effectively to gain insights from complex datasets and communicate findings with clarity.
![Free Printable Graph Paper Online [PDF Download] ✅ ❤️](https://igraphpaper.com/wordpress/wp-content/uploads/2024/04/igraphpaper-logo.png)
